8 Statement on using tools - Quarto
Quarto was announced in 2022 as the next generation of open-source scientific and technical publishing. R users were familiar (and still use) R Markdown and Quarto built upon this by supporting other open languages like Python, Julia and Javascript.
Users of R Markdown don’t have to migrate their work to Quarto but may find that the move to Quarto is easy and the added functionality, documentation and ongoing development worth starting new work using Quarto products.
8.1 HTML outputs and sensitive data
One area that is often asked is the security of data that is behind the charts that are often published through Quarto and R Markdown in HTML:
- Could someone pull out background data from the HTML files and view the row level data?
- Can someone find the suppressed numbers?
One way to see the underlying the HTML code in a report (or website) is by right clicking on the page and selecting “Inspect” in the drop down menu. For charts you can only see the “rendered” html and none of the code that has gone into generating it. This is a bit like Alternative text which can be produced with markdown or in R using the package {knitr} and these are both translated into html which is all that can be seen when inspected.
For example, looking at the html for the Slack metrics, published by NHS-R Community with the data through GitHub https://nhs-r-community.github.io/metrics/slack-metrics.html, right clicking on the chart and choosing “Inspect” highlights the chart code in html:
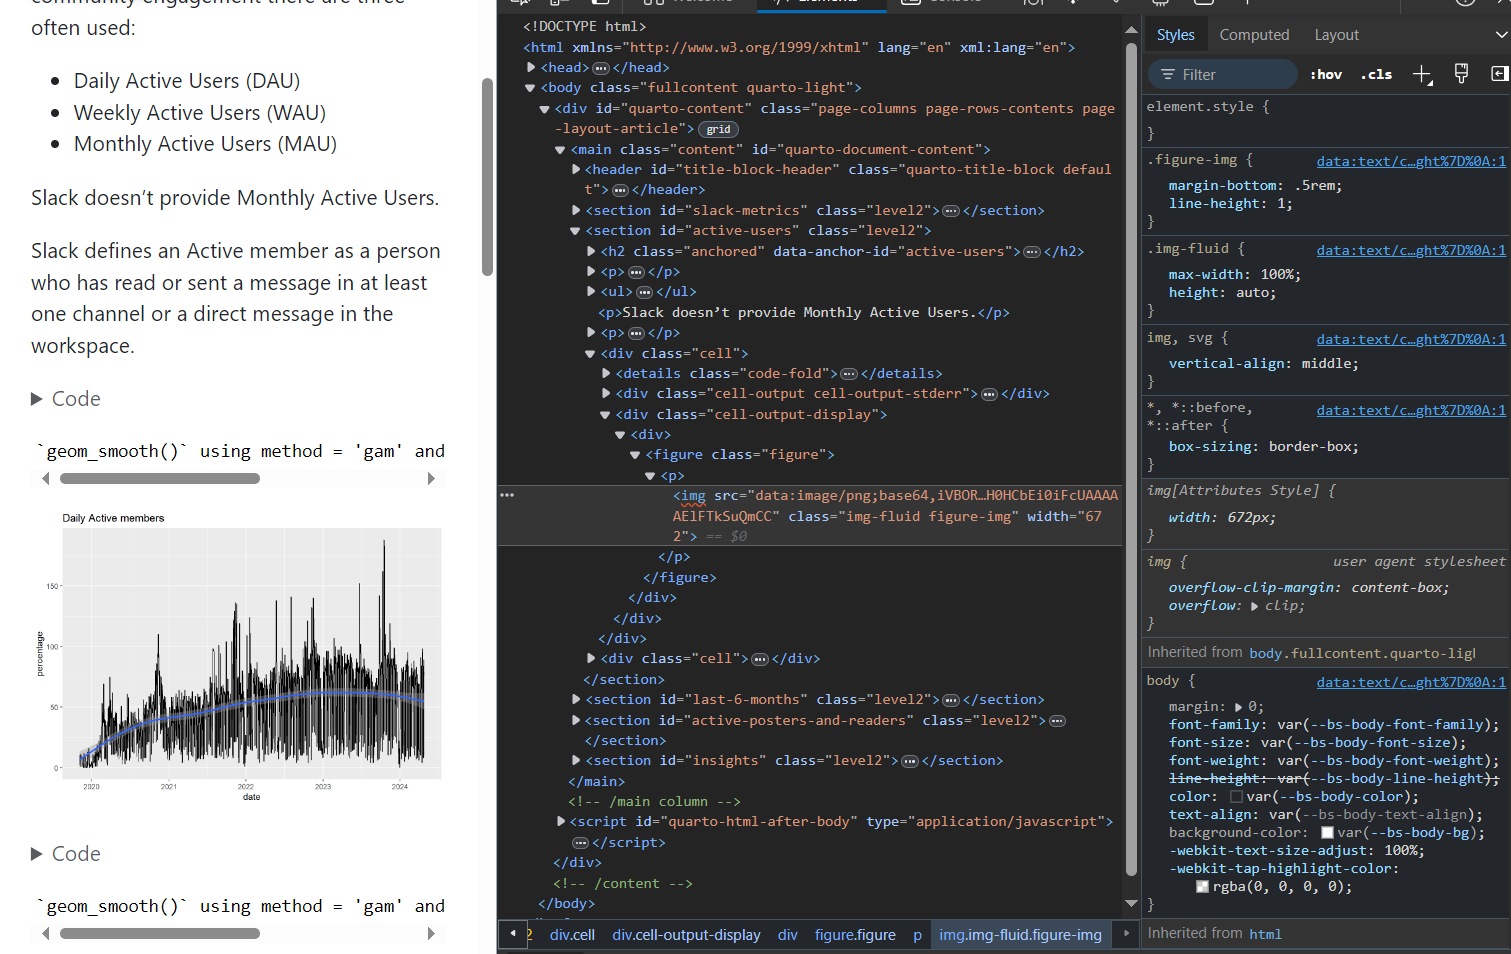
The data is plotted “as is” with no prior aggregation but does not show in the html https://github.com/nhs-r-community/metrics/blob/main/slack-metrics.qmd
8.2 Caution
8.2.1 Dynamic charts
Whilst static charts show HTML code as an image, more interactive charts like {plotly} or other visualisation codes may give more information away than was intended.
8.2.2 Pdfs or static charts of suppressed numbers
Even with pdfs there are tools like the R package {scrapR} written to extract point data where it is not shared so any small, suppressible data should therefore never be shared, even in a chart.
8.2.3 Code Tools
A useful function of Quarto and R Markdown is the inclusion of code through the use of the yaml (code-fold) but if the code includes any reference to small numbers of sensitive data directly, for example:
filter(NHSNumber == '4564564564')this would be a breach of sensitive information.
Referring to data, particularly sensitive data, in code is bad practice so preventing the use of a tool because of poor practice isn’t practical action.
We have to rely on people to not do certain things but also try to help as much as possible to avoid situations. Yet we have many situations where we continue to rely on people not doing things such as:
- using Excel and “hiding” tabs in documents that will be shared
- using (or forgetting to use) the blind copy (bcc) in emails when sending messages to a group of people outside the organisation.
We’d recommend Public Sector and Government colleagues use Notify, or something similar, as this is a free emailing service.